Introduction
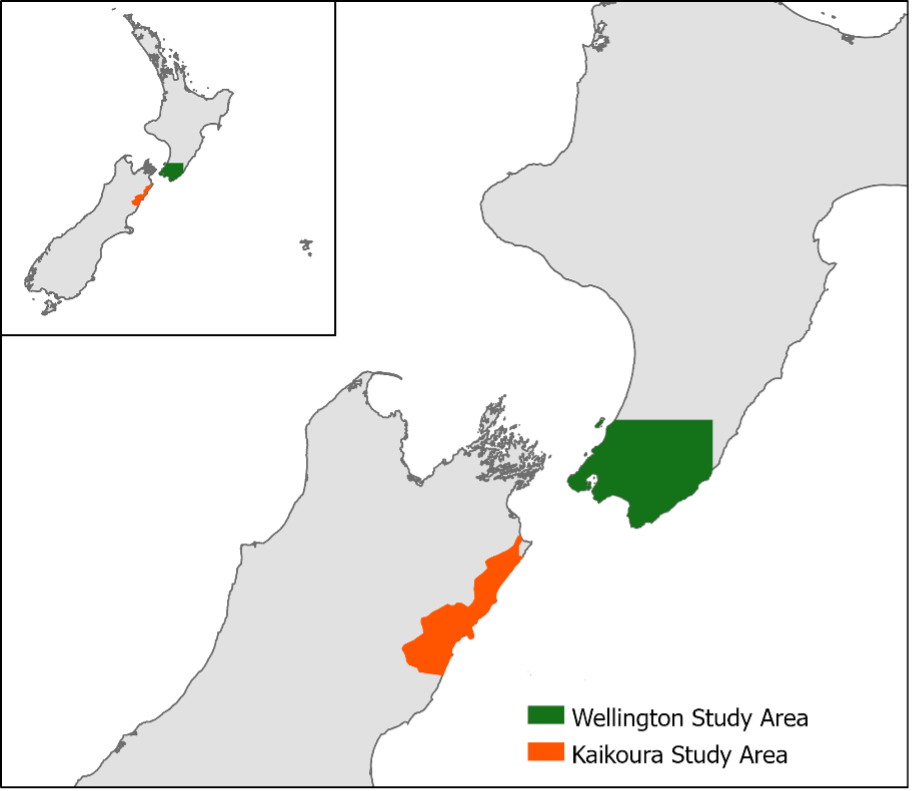
On the 14th of November 2016 a powerful earthquake hit Kaikoura, a sparsely populated area of New Zealand's South Island. The earthquake triggered tens of thousands of landslides (Dellow et al., 2017) which fortunately resulted in no loss of lives. If such an earthquake occurred in a more populated region such as Wellington, the damage could be much more severe to humans, infrastructure and the environment. To improve preparedness to landslides in Wellington, areas at risk from landslides need to first be identified. The purpose of this report will be to identify areas of Wellington at risk from landslides by considering both the probability of landslides occurring and their potential consequences (Jonkman, Van Gelder and Vrijling, 2003).
Following the 2016 earthquake in Kaikoura an inventory was created whereby every landslide in the region was systematically recorded (Dellow et al., 2017). This data provides a rare opportunity to train a machine learning algorithm to predict the presence or absence of landslides based on environmental characteristics. This algorithmic model can then be applied to other locations such as Wellington if the same environmental characteristics are known. Using predictions from this model combined with a multi-criteria decision analysis (MCDA) approach to calculate vulnerability, landslide risk can be quantified throughout the Wellington region.
Methods
This analysis was broken up into two stages: the first was modelling landslide hazards in Wellington, and the second was analysing the spatial vulnerability to landslides if they were to occur. The outputs of both stages were then combined to produce a map of the distribution of risk of landslides in Wellington.
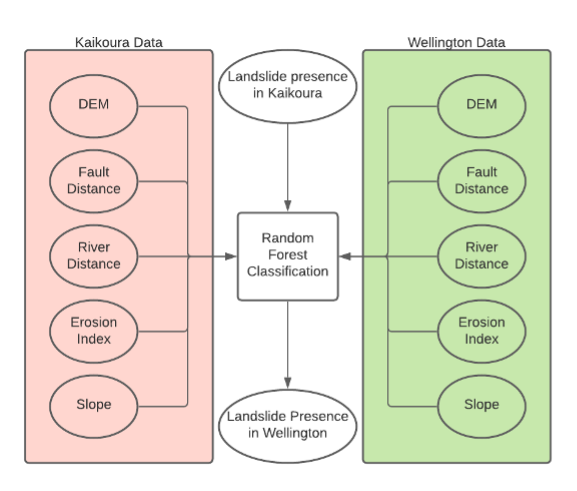
The modelling process relied on a random forest algorithm which was trained on data from the landslides that occurred in Kaikoura. The dependent variable was landslide presence or absence and the predictor variables represented features of the landscape that may impact the likelihood of a landslide, such as elevation, fault distance and erosion index (see figure 2). The trained model then used the same types of data from the Wellington region to make predictions about where landslides were likely to occur.
The vulnerability of the Wellington region to landslides was separated into three categories: human vulnerability, environmental vulnerability and infrastructure vulnerability. To quantify this vulnerability, a MCDA approach was utilised. This scored each square kilometre of Wellington based on several vulnerability criteria (table 1). A weighted sum of these scores was then used to quantify the vulnerability at each point in Wellington.
Table 1. Vulnerability Criteria and Weightings
| Vulnerability | Criteria | Scoring | Weighting |
|---|---|---|---|
| Human | Population density | Scores were assigned based on a quantile classification into ten groups, dividing values into 10 equal percentile ranges. | 0.5 |
| Infrastructure | Road length per km² | 0.1 | |
| Train track length per km² | 0.1 | ||
| Environment | Distance to protected area | 0.15 | |
| River length per km² | 0.15 |
A hazard factor from 1–3 was calculated for each square kilometre of Wellington. A score of 3 was given to areas where a landslide was predicted, a score of 2 was given to areas adjacent to landslide predictions, and 1 was given otherwise. This hazard score was then multiplied by the vulnerability score for each cell to produce a quantitative estimate of risk. Artificial surfaces were excluded from the risk analysis as it was assumed landslides are unlikely to occur in developed areas.
Results
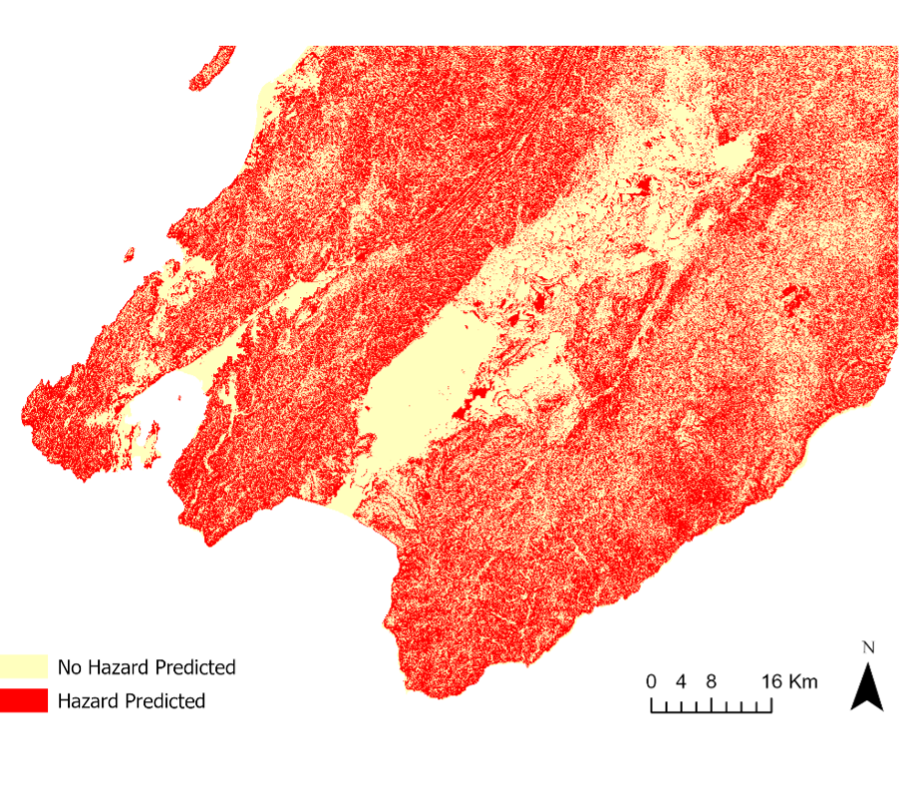
The random forest classification predicted that a majority of the Wellington region would be at risk of landslides if a similar earthquake occurred to that in Kaikoura (figure 3). The model exhibited an accuracy of 0.66 overall on test data, but this masks a poor sensitivity score for predictions that a landslide would not occur (0.46).
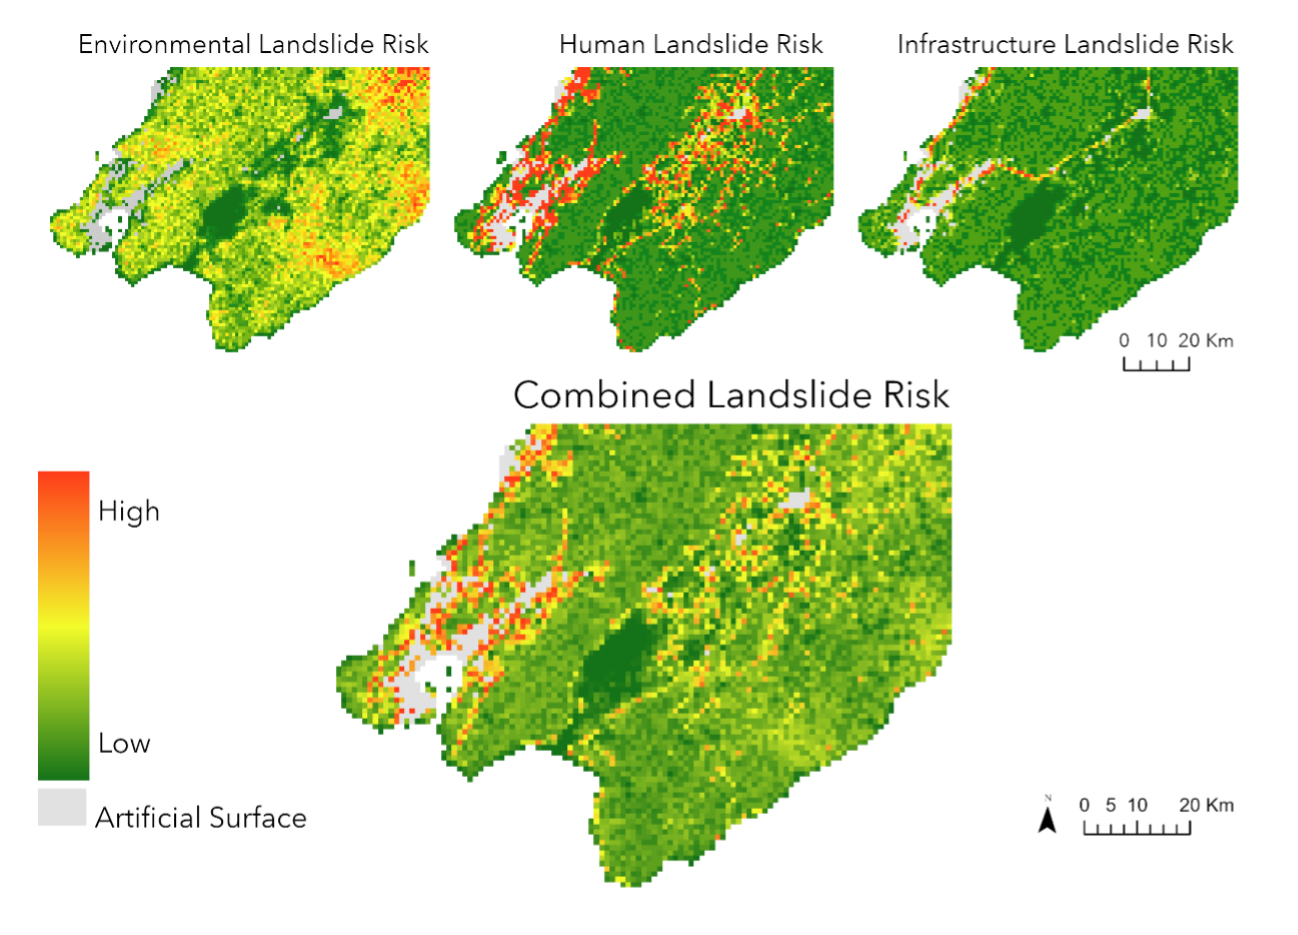
In figure 4 we can see that almost all of Wellington was categorised as either having a high or medium hazard level. The largest area categorised as low risk is predominantly composed of Lake Wairarapa and the surrounding valley. Due to the high weighting placed on infrastructure presence and population density, vulnerability is centred around the cities and towns of the Wellington region.
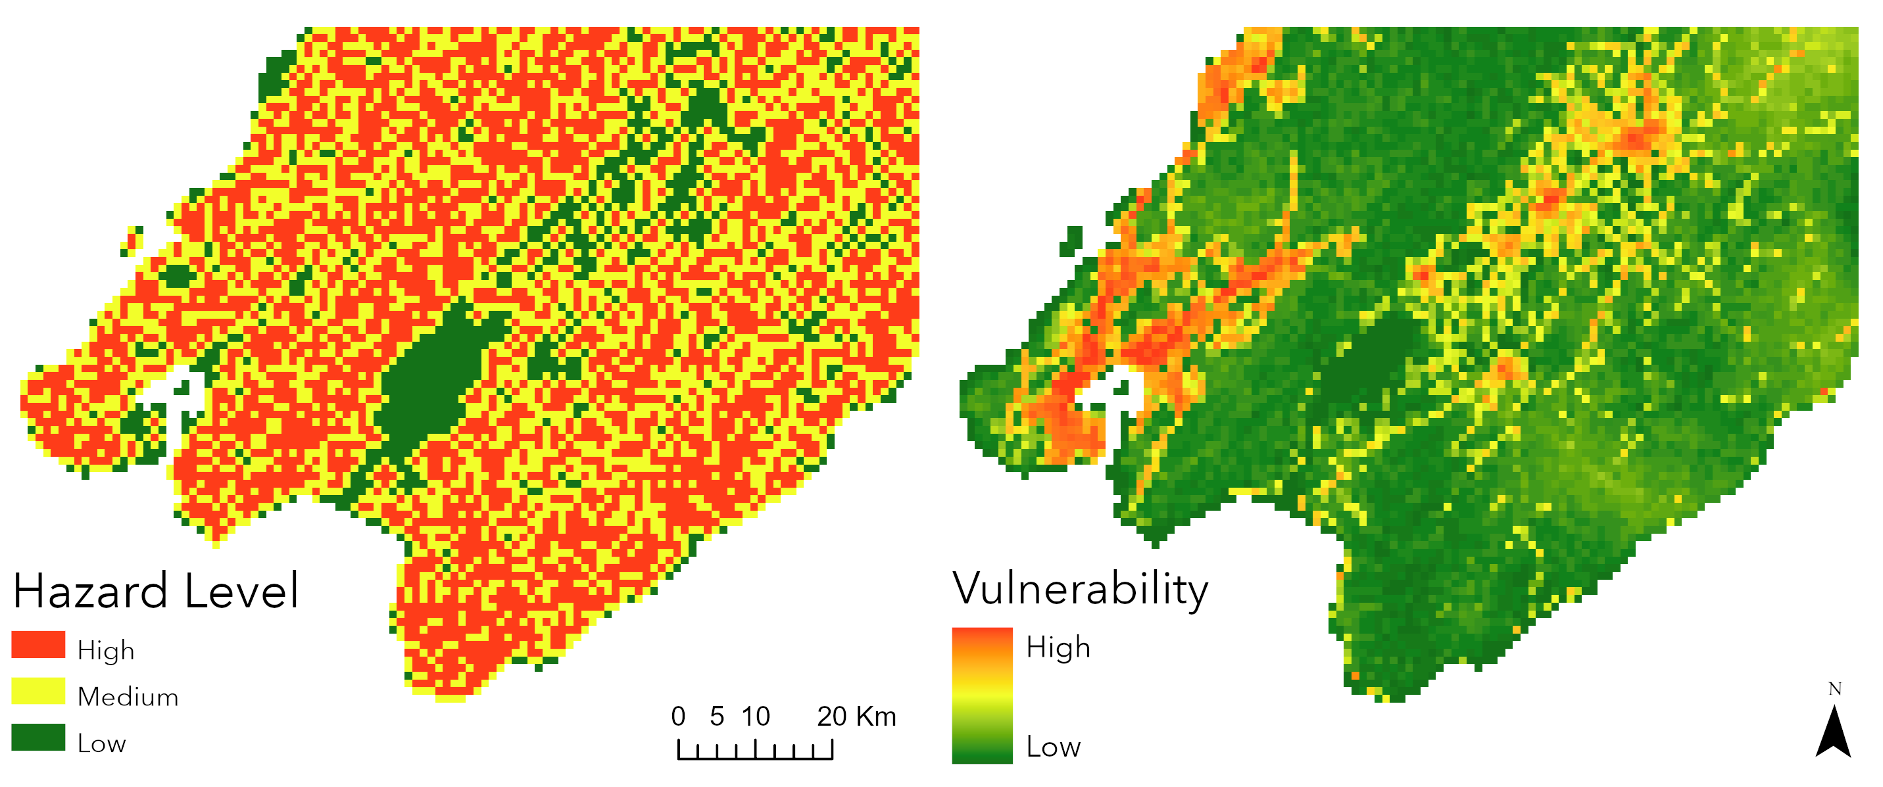
The highest landslide risk is located at the edge of urban areas (risk level of 18–20 out of a potential maximum of 30), as can be seen in figure 5. Further inland, some areas of moderate risk (11–13) follow major roads. The areas of lowest risk are those far away from human settlement, where no one is likely to be hurt in the case of a landslide event.
Discussion
In this analysis, the distribution of risk for landslides is predominantly influenced by the population density in areas where landslides are likely to occur. This is partly because population density is strongly correlated with infrastructure, and these two factors make up 0.7 of the weighting for vulnerability. As a result, areas on the margin of towns or cities are deemed most at risk. This makes sense as they contain moderate populations as well as undeveloped surfaces which could result in landslides.
The MCDA approach to quantify vulnerability appears to have been appropriate. In figure 5 we can see that each subset map does appear to capture its intended distribution, with human risk clustering around population centres and infrastructure risk appearing to follow roads or train lines. Environmental risk was probably the least effective of the vulnerability factors because its two input criteria were too simplistic and did not capture important factors such as the likelihood of landslide dams forming.
The conclusions of this analysis are limited by the quality of predictions created by the random forest model and the resolution at which those predictions were made and applied. From figure 3 it appears that the model has over-estimated the area where a landslide is likely to occur. One potential contributing factor is that the model's most important variable was elevation, but the difference in average elevation between Kaikoura and Wellington is significant (711 m vs 257 m). Normalisation of input values may have helped to ensure the model was more applicable across regions (Zhang, 2019). The resolution of the risk values was only 1 km² due to limitations in processing power. Preferably, a high-resolution DEM would have been used in this analysis along with further datasets such as lithology, slope length and topographic wetness index had they been readily available (Kavzoglu, Sahin and Colkesen, 2014).
Similar studies opted to use MCDA analysis to quantify not only vulnerability but also the likelihood that a landslide would occur (Kavzoglu, Sahin and Colkesen, 2014; Assilzadeh, Levy and Wang, 2010). This approach appears to have been more successful for judging the likelihood of landslides and providing a way to differentiate hazard levels further than a simple binary model.
This analysis should serve to highlight the areas where more detailed assessment of landslide susceptibility should be performed. Local governments may use this information to help prepare individuals living on the edges of cities or towns against landslides, as they are most at risk.
References
Assilzadeh, H., Levy, J.K. and Wang, X. (2010). Landslide catastrophes and disaster risk reduction: a GIS framework for landslide prevention and management. Remote Sensing, 2(9). doi:10.3390/rs2092259.
Dellow, S. et al. (2017). Landslides caused by the 14 November 2016 Kaikoura earthquake, South Island, New Zealand. In Proceedings 20th NZGS Geotechnical Symposium.
Jonkman, S.N., Van Gelder, P.H.A.J.M. and Vrijling, J.K. (2003). An overview of quantitative risk measures for loss of life and economic damage. Journal of Hazardous Materials, 99(1), pp. 1–30. doi:10.1016/S0304-3894(02)00283-2.
Kavzoglu, T., Sahin, E.K. and Colkesen, I. (2014). Landslide susceptibility mapping using GIS-based multi-criteria decision analysis, support vector machines, and logistic regression. Landslides, 11(3), pp. 425–439. doi:10.1007/s10346-013-0391-7.
Zhang, Z. (2019). Understand data normalization in machine learning. Medium. Available at: https://towardsdatascience.com/understand-data-normalization-in-machine-learning-8ff3062101f0 (Accessed: 9 December 2021).
Data Sources
| Description | Source |
|---|---|
| Wellington Road centrelines | data.linz.govt.nz |
| Wellington Rivers | data.linz.govt.nz |
| Wellington Population Grid | koordinates.com |
| Wellington Erosion Index | tools.envirolink.govt.nz |
| Wellington 25 m DEM | lris.scinfo.org.nz |
| Wellington Land Use Data | lris.scinfo.org.nz |
| Wellington Fault Traces | data.gns.cri.nz |
| Wellington Protected Areas | data.linz.govt.nz |
| Wellington Railway Lines | data.linz.govt.nz |
| Kaikoura Landslide (Presence/Absence) | Data provided, based on: Massey, C.I. et al. (2018). Kaikoura earthquake short term project: landslide inventory and landslide dam assessments. GNS Science report, 19, p. 45. |
| Kaikoura 30 m DEM | lris.scinfo.org.nz |
| Kaikoura Erosion Index | tools.envirolink.govt.nz |
| Kaikoura Land Use | lris.scinfo.org.nz |
| Kaikoura Faults | data.gns.cri.nz |
| Kaikoura Rivers | data.linz.govt.nz |