Introduction
The use of urban green space (UGS) is associated with both improved mental and physical health (Lee and Maheswaran, 2011), hence its distribution is an important problem of environmental justice in Mexico City. During the COVID-19 pandemic the importance of UGS has been elevated as they can provide respite from increased time spent indoors (Ugolini et al., 2020). Mexico City has been found to provide significantly lower access to UGS for marginalised populations (Fernández-Álvarez, 2017) and the City's COVID-19 measures have resulted in urban park closures which disproportionately affect low- and middle-income neighbourhoods (Mayen Huerta and Cafagna, 2021). This report aims to present an accurate picture of the distribution of access to UGS within Mexico City as a first step to reducing inequalities of access.
UGS is a limited resource, therefore access depends on the ratio between UGS capacity and the number of people potentially utilising it. To model this relationship, network analysis will be performed through an enhanced two-step floating catchment area method (Luo and Qi, 2009). This will provide a spatial accessibility value at each urban block in Mexico City. These results will then be compared to the distribution of poverty in the city which may help inform efforts to improve equity in the city.
Methods
This analysis primarily revolved around the enhanced two-step floating catchment area (E2SFCA) method described by Luo and Qi (2009). The first step of this process is finding the size of the population who live within three different travel distance intervals of each UGS (table 1). The population size is then multiplied by a weight based on how far it is to walk to the UGS. For each UGS we then find its capacity-to-population ratio.
The second step is to find the weighted sum of the capacity-to-population ratios for UGS nearby each urban block to calculate the block's level of access. The resulting value at each urban block incorporates both the UGS capacity proximate to each urban block and the amount of demand placed on the UGS.
Table 1. Distance Interval Weighting
| Interval (metres) | Weighting |
|---|---|
| 0 – 500 | 1 |
| 500 – 1500 | 0.5 |
| 1500 – 2500 | 0.25 |
To perform this analysis, three primary datasets were used: polygons representing all the UGS in Mexico City, point data representing the centroid of each of the city's urban blocks, and a road network layer.
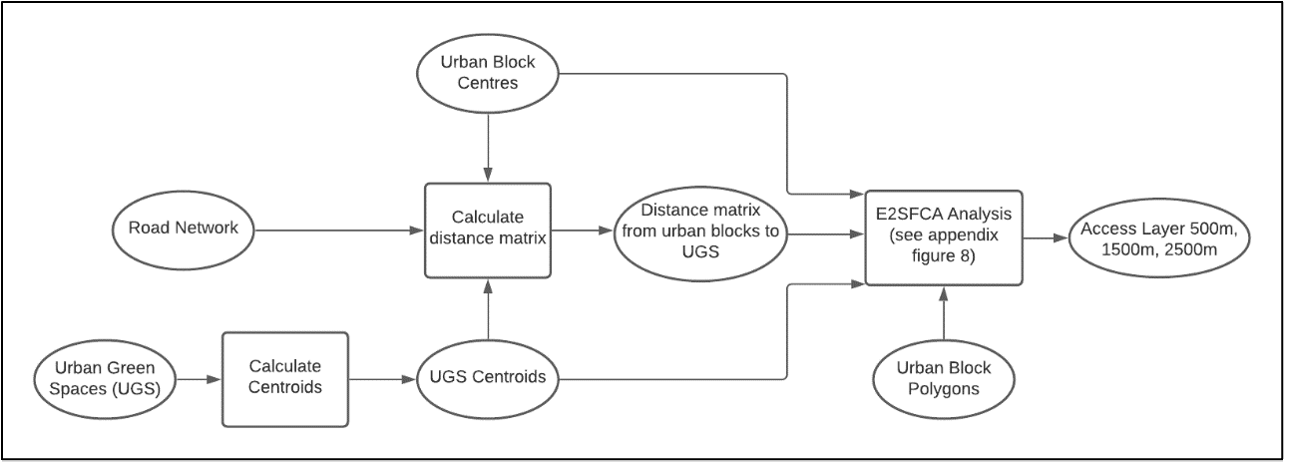
The E2SFCA process requires a distance matrix as an input, which calculates how far it is to walk from each urban block to all the UGS in the city. The process also requires capacity measures for each of the UGS polygons. The capacity was based on UGS size categories described by Mayen Huerta (2021), although the actual capacity values were estimates (table 2).
Table 2. UGS Capacity Estimates
| Size (Hectares) | Category | Estimated Capacity (People) |
|---|---|---|
| > 100 | City Park | 10,000 |
| 20 – 100 | District Park | 5,000 |
| 8 – 20 | Neighbourhood Park | 1,000 |
| 0 – 8 | Children's Park | 500 |
With these inputs the E2SFCA analysis was performed by translating the steps outlined above into a series of table manipulations (see appendix figure 7). Additionally, three further non-enhanced versions of the floating catchment area analysis (Luo and Wang, 2003) were performed to compare the results of the techniques. This process differs by only using a single catchment distance and no weightings.
Results
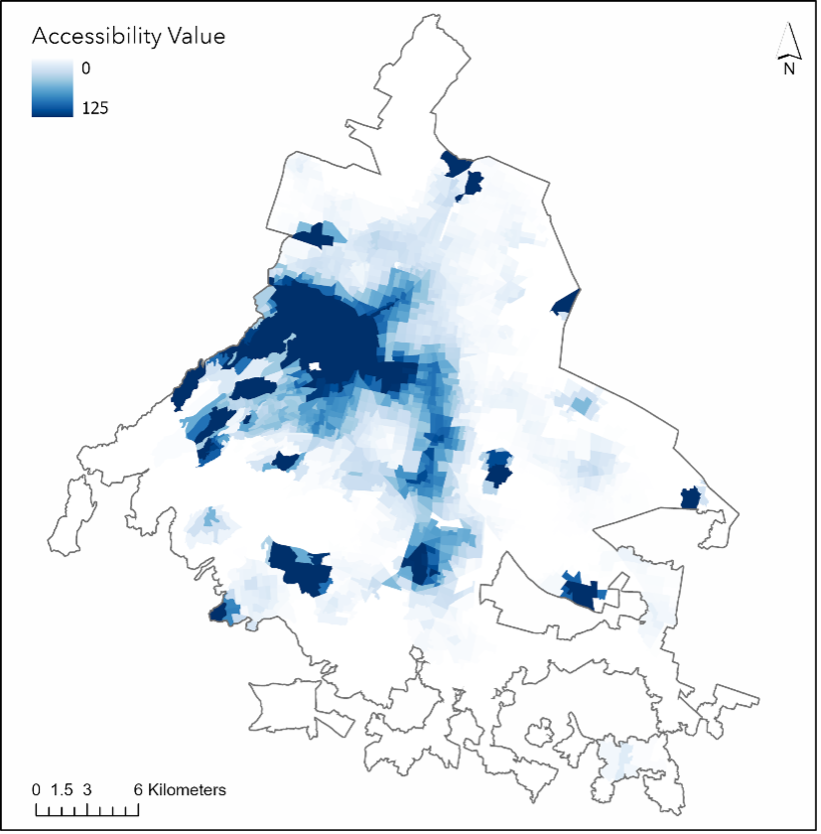
There were large disparities throughout Mexico City in terms of accessibility to UGS. As can be seen in figure 3, the West of the city was the largest region of high accessibility, with the North and particularly the South having few or no UGS at all within walking distance. Areas that are faintly blue either have few nearby UGS or the proximate population is too large to be serviced by the nearby green space. An accessibility value of zero indicates that a given urban block has no parks within 2500 m, but higher scores should only be understood as providing relative measures of accessibility rather than providing an absolute amount.
In figure 4, one can see that the distribution of accessibility closely mirrors the distribution of poverty in Mexico City. Only small pockets of high UGS accessibility in the East and North appear to ignore this trend. To attempt to quantify this relationship, a generalised linear regression was used but it did not appear to be linear, with an R-squared value of 0.0085.
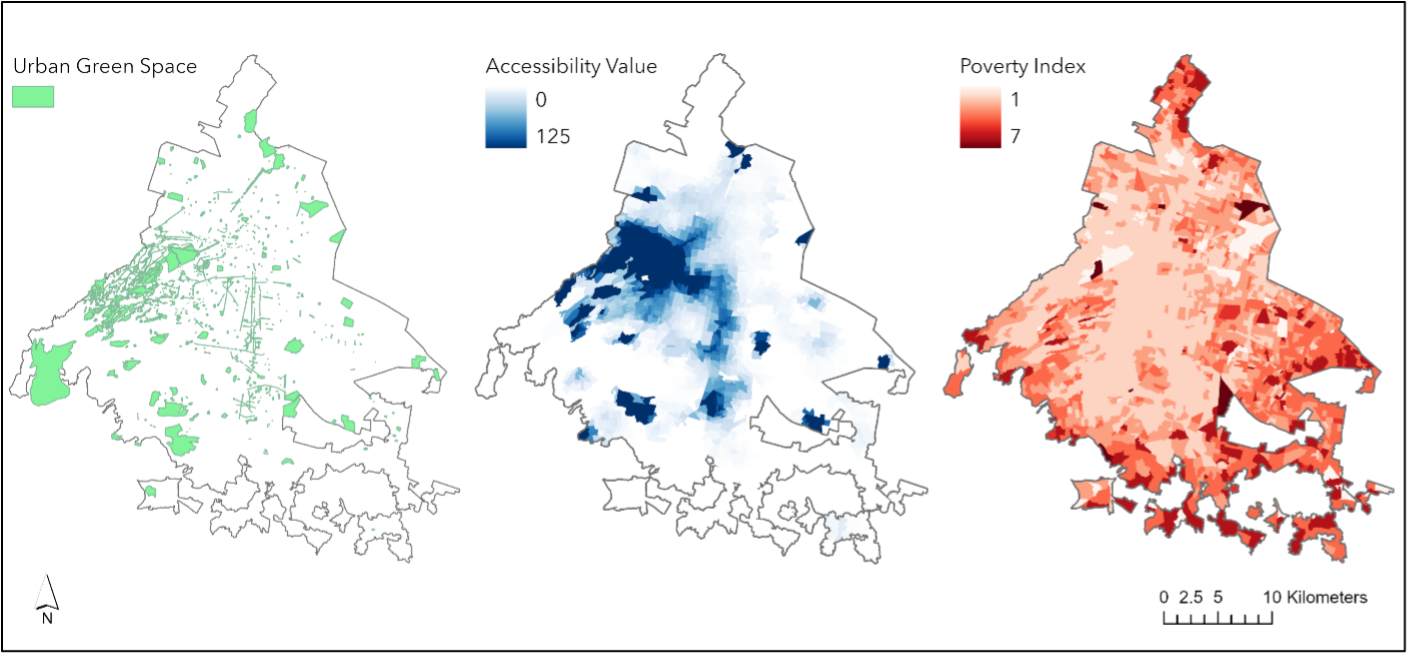
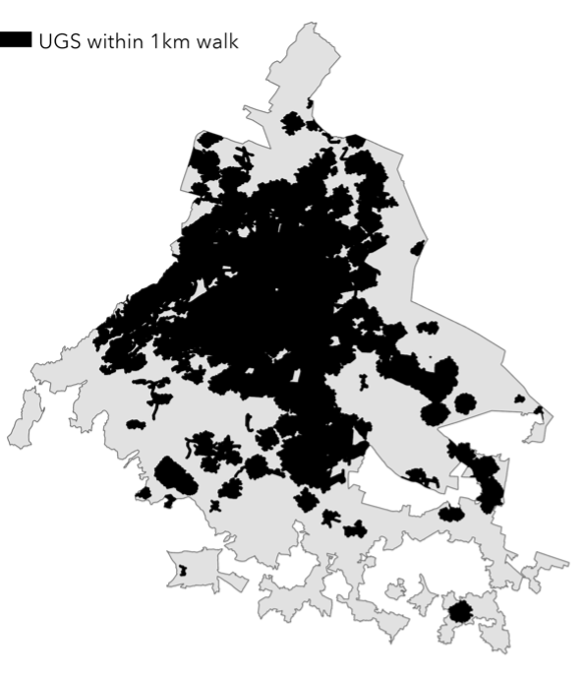
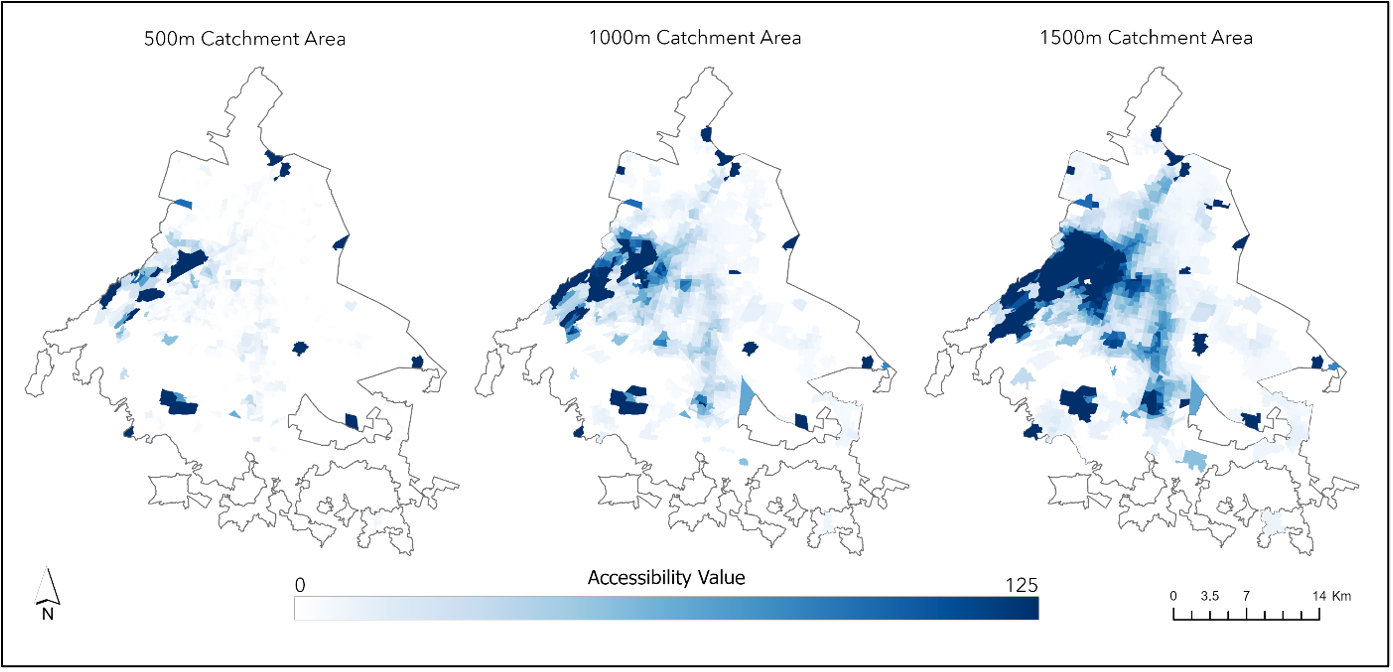
Figure 5 reveals that there are relatively few urban blocks in Mexico City within a 500 m walk of a UGS. On the other hand, using a 1500 m catchment area we can see that approximately half of Mexico City falls within this area, but the same inequalities of access still exist.
Discussion
The results of this analysis clearly suggest that work must be done to improve access to UGS for lower income areas in Mexico City. The solution is unlikely to be as simple as constructing more parks in the East and South of the city, however. It is possible that the construction of new UGS will result in gentrification (Fernandez et al., 2019) which ultimately may not help the poorer populations of Mexico City to gain the benefits of UGS.
The enhanced two-step floating catchment area approach for this context appears to have been appropriate (figure 2), especially when compared to the non-enhanced approach (figure 5). The approach has captured the idea that areas closer to UGS tend to have higher accessibility unless too many people rely on a small amount of UGS. The enhancement to the method helps to model the fact that when people must travel further to reach UGS they are less likely to do so — this is known as the distance-decay effect (Brockmann et al., 2006).
One limitation of the E2SFCA approach relates to its sensitivity to the chosen input capacity values and distance-decay weightings. The overall distribution of accessibility, however, will remain the same for all sensible inputs, though the inequalities may be more or less extreme. Further problems include not considering UGS outside of the confines of the city. An inspection of satellite imagery reveals greenery across much of the city's border which could potentially be utilised by those on the city's edges. Additionally, it is not evident that UGS access responds linearly to the number of people using the park. For example, a UGS may feel safer when many people are using it and therefore become more accessible (Mayen Huerta and Cafagna, 2021). Finally, the use of centroids rather than more precise locations to represent parks and urban blocks meant that some distance measures were inaccurate, particularly for larger parks.
Through this analysis a clear picture of the distribution of access to UGS has been created. Areas identified to have low UGS accessibility should be the focus of efforts to improve environmental justice in Mexico City. Further work is required to quantify and validate the intuitive inverse relationship between access and poverty levels in Mexico City.
References
Brockmann, D., Hufnagel, L., & Geisel, T. (2006). The scaling laws of human travel. Nature, 439(7075), 462–465. https://doi.org/10.1038/nature04292
Fernandez, M., Harris, B., & Becerra, M. (2019). Examining the complexities of increasing park access in two Latinx neighbourhoods. Local Environment, 24(12), 1136–1155. https://doi.org/10.1080/13549839.2019.1683722
Fernández-Álvarez, R. (2017). Inequitable distribution of green public space in Mexico City: an environmental injustice case. Economía, sociedad y territorio, 17(54), 399–428. https://doi.org/10.22136/est002017697
Lee, A. C. K., & Maheswaran, R. (2011). The health benefits of urban green spaces: a review of the evidence. Journal of Public Health, 33(2), 212–222. https://doi.org/10.1093/pubmed/fdq068
Luo, W., & Wang, F. (2003). Measures of spatial accessibility to health care in a GIS environment: synthesis and a case study in the Chicago Region. Environment and Planning B: Planning and Design, 30(6), 865–884. https://doi.org/10.1068/b29120
Luo, W., & Qi, Y. (2009). An enhanced two-step floating catchment area (E2SFCA) method for measuring spatial accessibility to primary care physicians. Health & Place, 15(4), 1100–1107. https://doi.org/10.1016/j.healthplace.2009.06.002
Mayen Huerta, C., & Cafagna, G. (2021). Snapshot of the use of urban green spaces in Mexico City during the COVID-19 pandemic: a qualitative study. International Journal of Environmental Research and Public Health, 18(8), 4304. https://doi.org/10.3390/ijerph18084304
Mayen Huerta, C. (2021, November 25). The use of urban green spaces in Mexico City and its effect on wellbeing. The University of Melbourne.
Ugolini, F., Massetti, L., Calaza-Martínez, P., Cariñanos, P., Dobbs, C., Ostoic, S. K., ... & Pearlmutter, D. (2020). Effects of the COVID-19 pandemic on the use and perceptions of urban green space: an international exploratory study. Urban Forestry & Urban Greening, 56, 126888. https://doi.org/10.1016/j.ufug.2020.126888
Data Sources
Road Network
BBike, 2019. BBBike extracts. extract.bbbike.org
Urban Blocks
CONEVAL, 2019. Índice de Rezago Social. coneval.org.mx
INEGI, 2013. Censos y Conteos. inegi.org.mx
UGS Polygons
Green Spaces, unknown author, retrieved from assignment sheet.